A KPI (key performance indicator) is a number that shows every week or every month whether a business is getting closer to its goal. In a clinic that usually means 5-9 numbers: the no-show rate, schedule utilization, time to the next available appointment, answered calls, new patients and where they came from, returning patients, revenue per doctor hour, Google reviews and NPS. How a manager goes through them every week is covered in my guide to running a medical practice.
I run Repto, which helps medical practices collect Google reviews from patients, so I know one number on this list best. The clinic can calculate the rest from data it already has, from its practice management software and its phone system, without buying a new tool.
What are KPIs?
KPI stands for key performance indicator. Any number you can count is a metric, but a number only becomes a KPI once it has a target, a result you agree counts as good. The number of visits in a month is a metric. The no-show rate with the target "below last quarter's level" and a person responsible for it is a KPI.
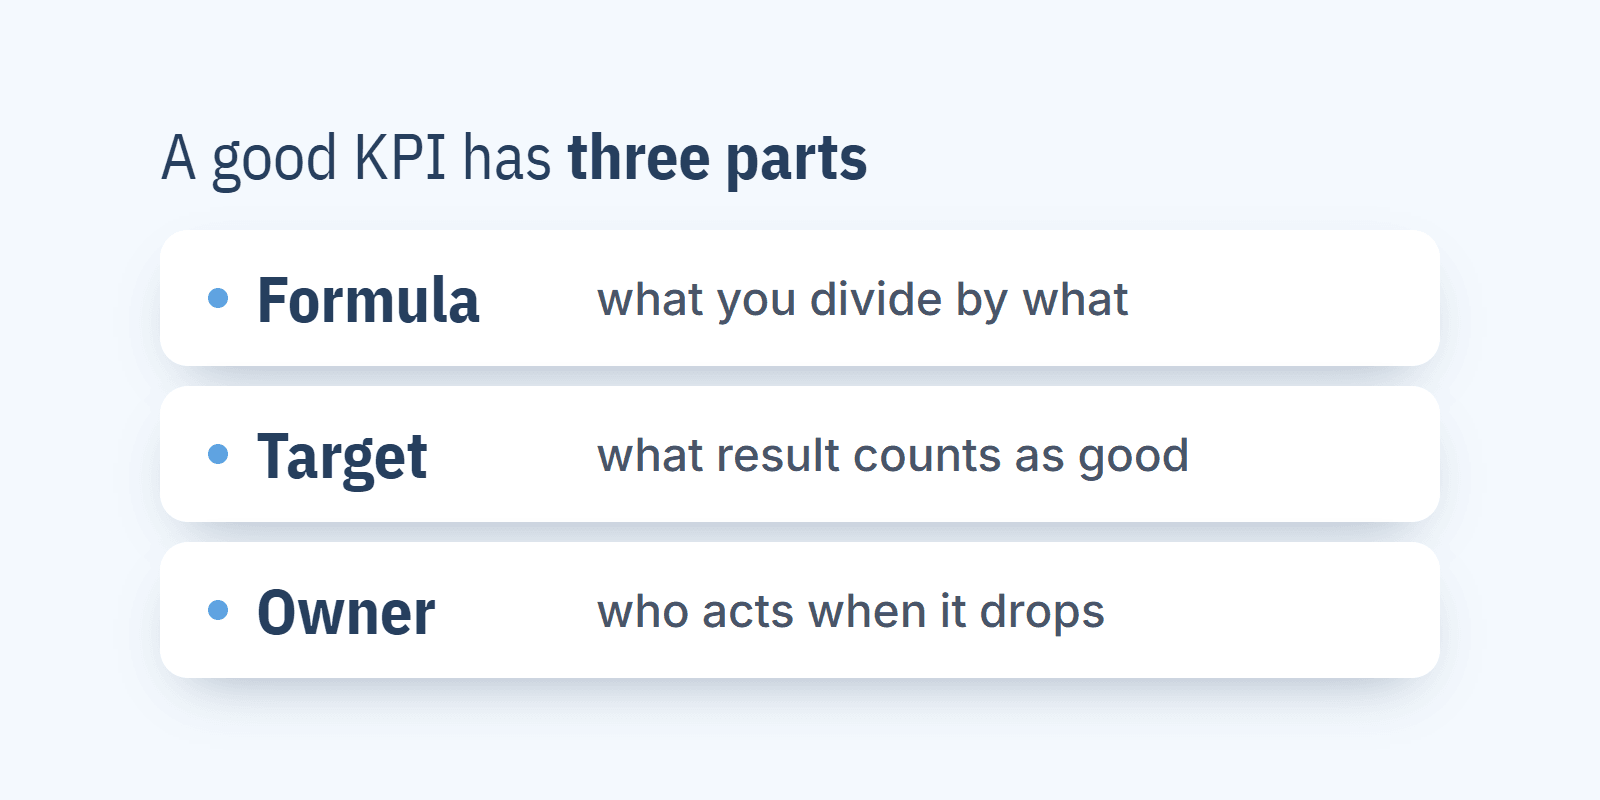
So a good KPI has three parts: a formula (what you divide by what), a target (what result counts as good) and an owner (who acts when the result drops). Without an owner, all that's left is a colorful Excel sheet that everyone looks at and nobody does anything with.
Which KPIs should a clinic track? Examples with formulas
Below are 9 KPIs that work for a multispecialty clinic, a dental practice and a diagnostic center. For each one I give the formula, the data source and what to look at.
1. No-show rate
Formula: visits the patient missed without canceling / all booked visits x 100%.
The data is in your practice management software, as long as the front desk records the visit status consistently. Count cancellations made in advance separately, because the front desk can still give that slot to someone else, while a slot left empty by a no-show is lost. This KPI tells you the most when you split it by doctor and by day of the week. The simplest way to bring it down is an SMS reminder the day before the visit, which most practice management systems already offer.
2. Schedule utilization (rooms, dental chairs, scanners)
Formula: hours booked with visits / hours available in the schedule x 100%.
In a clinic you calculate it for each doctor and each room, in a dental practice for each chair, and in diagnostics for each machine, because an hour of an empty MRI scanner costs as much as an hour of a fully booked one. Last month's utilization tells you what happened, while utilization for the next 2 weeks still leaves you time to do something about it.
3. Time to the next available appointment
Formula: the number of days from today to the third next available appointment with a given doctor or in a given specialty, checked every week on the same day.
Why the third and not the first? Because the first open slot is often a gap left by someone's cancellation, and it will be gone within the hour. When the wait is long, some patients go to a competitor, but a slot tomorrow with every doctor usually means the schedule isn't full enough.
4. Answered calls
Formula: answered calls / all incoming calls x 100%.
You'll find the data in your phone system's dashboard or your provider's portal. Next to this number, look at missed calls nobody returned the same day, because those are often patients who booked somewhere else. The result for Monday between 8 and 10 am can look completely different from the weekly average, so break it down by day and hour before you put another person on the front desk or sign up for a virtual receptionist.
5. New patients per month and their source
Formula: the number of patients with a first visit in a given month, split by source.
Your practice management software will show the number of new patients. The source is harder: some systems record where an online booking came from (your website, a booking portal, Google), and the rest you collect by asking at the front desk: "How did you hear about us?" For paid channels there's a second KPI: patient acquisition cost, the monthly marketing spend on that channel / the number of new patients from that channel.
6. Returning patient rate
Formula: patients with a first visit in a given quarter who came back within 6 months / all new patients from that quarter x 100%.
Track it where coming back is part of the treatment: follow-ups, check-ups, chronic conditions, treatment courses. A patient who had a one-off consultation and got better has no reason to come back, and that says nothing bad about the clinic. The standard retention formula and ways to raise it are in my guide to patient retention.
7. Revenue per doctor hour
Formula: revenue from a given doctor's visits in a month / that doctor's hours in the schedule.
The denominator is every hour in the schedule, empty ones included, which is why this KPI captures prices and empty slots at the same time. Compare doctors only within the same specialty, because an hour of a cardiologist doing echocardiograms and an hour of a GP are very different hours. A clinic that pays doctors a percentage of revenue can also track what's left for the clinic after the doctor's share.
8. Google rating and new reviews per month
Formulas: the average rating of your Google Business Profile, the number of new reviews in the month, and reviews with a reply from the clinic / all reviews from the month x 100%.
You can get all three from your profile on Google Maps, and a future patient sees the rating and the reviews too, before they even call. For a benchmark from Poland, our analysis of 653 public Google Business Profiles of medical facilities in Kraków, Poland (as of 20 October 2026) found that a typical profile gets about 1 new review a month, and 25% of profiles get almost 3 new reviews a month or more. Private facilities there average 4.5 stars, private dental practices 4.6 and private multispecialty clinics 4.4.
At 1 new review a month, a single 1★ review stays among the most recent reviews on the profile for many months. That's why the clinic should reply to a new 1-4★ review the same week, while checking the average rating once a month is enough. The Google rating calculator shows how many 5★ reviews stand between your clinic and a higher average. For comparison, a Polish clinic with 600-700 visits a month that asks for a review after every visit collects an average of 35 new reviews a month. How to get more reviews is covered in my guide to Google reviews for medical practices. Repto sends patients an SMS asking them to rate the visit the day after. A patient who rates the visit below 5 writes to the clinic first, and the manager gets an email and can call back before the problem reaches Google. If you'd like to see how that works in your clinic, book a short call with us.
9. NPS
Formula: the percentage of promoters (scores 9-10) minus the percentage of detractors (scores 0-6), from the question "How likely are you to recommend us to a friend or family member?" on a 0-10 scale.
NPS measures something your practice management software can't show: whether the patient would recommend the clinic. The score ranges from -100 to 100 and only means something with a few dozen responses in the period. I explain how to collect responses and what to do with detractors in the post on NPS in healthcare, and the comparison of ways to measure patient satisfaction shows how NPS differs from CSAT and a satisfaction survey.
How to calculate a clinic's KPIs: a worked example
The numbers below are made up and only show the arithmetic. A clinic with 10 doctors, in October:
booked visits: 1,500, of which 105 patients didn't turn up and didn't cancel, so the no-show rate is 7% (105 / 1,500 x 100%),
doctors' hours in the schedule: 1,400, hours booked with visits: 1,190, so utilization is 85% (1,190 / 1,400 x 100%),
incoming calls: 2,600, answered: 2,210, so 85% of calls were answered, and 390 calls went unanswered,
revenue from visits: 420,000 in the clinic's currency, so revenue per scheduled hour is 300 (420,000 / 1,400),
new patients: 320, of which 140 came from online booking, 110 from referrals and 70 from other sources,
new Google reviews: 2, average profile rating 4.3.
The numbers alone don't say much. They start to mean something when you compare them with previous months or with another number from the same report. A 7% no-show rate against 5% a quarter earlier is a signal to check the SMS reminders, and 390 missed calls against 320 new patients in a month is a signal to check how many of those numbers the front desk called back. And 2 new reviews a month is more than a typical profile in Kraków gets, but with close to 1,400 completed visits it's still one review per 700 visits.
How many KPIs does a clinic need?
To start, 5-7 KPIs, each with one owner. With 15 numbers in the report nobody remembers which one matters, and with two you can't see half of what's happening in the clinic.
I'd start with six: no-shows, schedule utilization, answered calls, new patients, revenue per doctor hour and new Google reviews. I'd add time to the next available appointment, returning patients and NPS once the first six are working. When to check them:
every week: schedule utilization for the next 2 weeks, no-shows, answered calls, time to the next available appointment and new Google reviews,
every month: new patients and their sources, revenue per doctor hour, the average Google rating and NPS,
every quarter: the returning patient rate, because it barely changes within a month.
A KPI's owner is the person who can do something about it. Answered calls belong to the front desk lead, schedule utilization to the practice manager, and revenue per doctor hour to the clinic owner, because the owner is the one who talks to doctors about pay.
How do you set a KPI target?
Ideally from your own data for the last 3 months. Calculate the KPI for each of them, take the average as your starting point and set the target as a specific improvement, for example a no-show rate from 7% down to 5% within a quarter. Industry averages you find online rarely fit your clinic, because they depend on the specialty, the share of publicly funded patients, the city and how the front desk records visit statuses.
Google reviews are the exception, because competitors' numbers are public. You can see on Google Maps how many reviews the clinics near you have and what rating they hold, and the Google review calculator shows how many 5★ reviews it takes to reach 4.5 or 4.8.
What mistakes most often ruin KPIs?
A number nobody acts on. If the result drops for the second month in a row and nobody changes anything, the KPI either has no owner or nobody needs it.
Changing the definition midway. Count no-shows with cancellations one month and without them the next, and comparing months stops making sense.
Comparing doctors from different specialties, or publicly funded and private-only clinics, with one measure.
Using KPIs as a stick to beat the front desk with. If a low answered-call rate means a penalty, you'll get calls that are answered and put straight on hold. The KPI should show where you're short of staff or missing a process.
Money only. Revenue drops last, a few months after the answered-call rate and the number of new patients have already fallen.
FAQ
What is a KPI in simple terms?
It's a number with a target. It shows whether the business is heading in the right direction, for example whether the clinic answers enough calls or whether patients turn up for booked visits. What sets it apart from an ordinary statistic is that it has a threshold and a person who acts when the result drops.
What are examples of front desk KPIs?
The answered call rate, the number of missed calls nobody returned, the no-show rate (if the front desk confirms visits) and the time to the next available appointment. These numbers also depend on the schedule and on how many people are on shift, so review them with the front desk lead rather than holding individual staff to them.
Which KPIs should a dental practice track?
The same as a clinic, with utilization counted per chair, plus the treatment plan acceptance rate (plans the patient has started / plans presented to patients x 100%) and the percentage of patients who came in for their scheduled check-up. Numbers for dentists are in the article on dental practice management.
Do you need special software to calculate KPIs?
Not at the start. A spreadsheet is enough: once a week, copy in the reports from your practice management software, your phone system dashboard and your Google Business Profile. Practice management systems differ in the reports they offer and in how they export data, so check that before you choose one.
What's the difference between a KPI and a goal?
A goal says where the clinic wants to get, for example "patients never wait more than a week for a visit". A KPI measures how far it is from that goal, which in this example is the time to the third next available appointment, checked every week.